Packaging line efficiency is one of the most practical indicators for measuring how well a production system performs. When efficiency drops, the result is usually obvious: more downtime, higher waste, lower output, and rising operating costs. When efficiency improves, the line becomes more stable, predictable, and profitable.
This guide explains how to calculate packaging line efficiency in a simple way, what metrics matter most, and how manufacturers can improve production performance with better monitoring, maintenance, and automation.
What Is Packaging Line Efficiency?
Packaging line efficiency refers to how effectively a packaging line converts scheduled production time into quality output. In simple terms, it compares what the line actually produced against what it should have produced under normal operating conditions.
It is commonly influenced by:
- Machine speed losses
- Unplanned downtime
- Changeover time
- Operator delays
- Rejected or reworked packages
- Material feeding interruptions
For food, pharmaceutical, cosmetic, chemical, and daily-use product factories, tracking this metric helps managers identify bottlenecks before they affect delivery schedules and margins.
The Basic Formula for Packaging Line Efficiency
A simple way to calculate packaging line efficiency is:
Packaging Line Efficiency (%) = (Actual Output ÷ Theoretical Maximum Output) × 100
Where:
- Actual Output = the number of good packages produced during the measured period
- Theoretical Maximum Output = the number of packages the line should produce at standard speed during the same time
Example
If your packaging line is designed to run at 120 packs per minute for 8 hours, then:
- Theoretical output = 120 × 60 × 8 = 57,600 packs
- Actual good output = 48,960 packs
Efficiency = (48,960 ÷ 57,600) × 100 = 85%
That means the line achieved 85% of its expected production capability.
A More Accurate Method: Availability × Performance × Quality
Many manufacturers use a more detailed method similar to OEE logic. This gives a clearer view of where efficiency is being lost.
| Factor | Formula | What It Measures |
|---|---|---|
| Availability | Run Time ÷ Planned Production Time | Downtime losses |
| Performance | Actual Speed ÷ Standard Speed | Speed losses and minor stops |
| Quality | Good Output ÷ Total Output | Rejects, leaks, seal failures, underfills |
Packaging Line Efficiency = Availability × Performance × Quality × 100
Detailed Example
- Planned production time: 480 minutes
- Downtime: 60 minutes
- Run time: 420 minutes
- Standard speed: 120 packs/minute
- Actual speed: 110 packs/minute
- Total output: 46,200 packs
- Good output: 45,000 packs
- Availability = 420 ÷ 480 = 87.5%
- Performance = 110 ÷ 120 = 91.7%
- Quality = 45,000 ÷ 46,200 = 97.4%
Efficiency = 0.875 × 0.917 × 0.974 × 100 = 78.1%
This method is more useful because it shows whether the main problem comes from downtime, speed loss, or quality defects.
Key Data You Need Before Calculating
To calculate packaging line efficiency correctly, collect reliable production data first. Poor data often leads to wrong decisions.
Minimum data set
- Planned shift time
- Actual running time
- Machine rated speed
- Actual production speed
- Total output
- Good output
- Reject quantity
- Downtime reason codes
Useful supporting data
- Changeover time per SKU
- Material shortage time
- Operator intervention frequency
- Cleaning and sanitation time
- Maintenance stoppages
- Seal integrity or fill-weight defect rates
What Is a Good Packaging Line Efficiency Rate?
There is no single perfect number for every factory, because targets depend on product type, package format, automation level, hygiene requirements, and changeover frequency. Still, general reference ranges can help.
| Efficiency Rate | Typical Interpretation |
|---|---|
| Below 60% | Serious losses, major downtime or process instability |
| 60%–75% | Average, but with clear room for improvement |
| 75%–85% | Good performance for many packaging environments |
| 85%+ | Strong operational control and high line discipline |
High-mix production lines with frequent format changes may run at a lower efficiency than long-run standardized lines, but still perform well operationally.
Common Reasons Packaging Line Efficiency Drops
Most performance losses come from a few repeatable causes. Once these are categorized correctly, efficiency improvement becomes much easier.
1. Unplanned downtime
- Sealing jaw faults
- Film tracking problems
- Sensor failure
- Feeding interruptions
- Conveyor jams
2. Slow running speed
- Line is set below rated speed
- Inconsistent product flow
- Operators reduce speed to avoid rejects
- Upstream or downstream mismatch
3. Quality defects
- Incorrect fill weight
- Poor sealing quality
- Leaking pouches or sachets
- Misprinted coding
- Wrong carton count
4. Long changeovers
- SKU variation
- Manual adjustment points
- Tool replacement delays
- Cleaning and sanitation complexity
5. Poor line balancing
Even if one machine is fast, the overall line will underperform if feeders, weighers, cartoners, labelers, or case packers cannot keep pace.
How to Improve Packaging Line Efficiency
Improvement should focus on the biggest losses first. A structured approach usually delivers faster ROI than trying to optimize everything at once.
Track downtime by cause
Do not record downtime only as “machine stopped.” Break it into categories such as film issue, product feed issue, electrical fault, operator waiting, cleaning, and maintenance. This helps identify the true bottleneck.
Reduce micro-stoppages
Short stops of a few seconds may seem minor, but repeated micro-stoppages can significantly reduce line efficiency over a full shift. Monitor recurring interruptions carefully.
Improve preventive maintenance
A preventive plan should include inspection of wear parts, sealing units, cutters, sensors, belts, pneumatic components, and dosing systems. Consistent maintenance usually improves availability faster than reactive repair.
Optimize changeovers
- Standardize setup procedures
- Use quick-change tooling
- Prepare materials before shutdown
- Train operators with setup checklists
Match machine capacity across the line
A packaging line should be designed as a system, not as isolated machines. Fillers, sealers, conveyors, coding units, checkweighers, cartoners, and palletizing equipment should work at compatible speeds.
Use real-time production monitoring
Digital monitoring gives operators and managers instant visibility into output, reject rates, downtime, and speed losses. This shortens response time and improves accountability.
Improve operator training
Well-trained operators can often prevent jams, detect abnormal vibration, adjust feeding consistency, and respond faster to process changes.
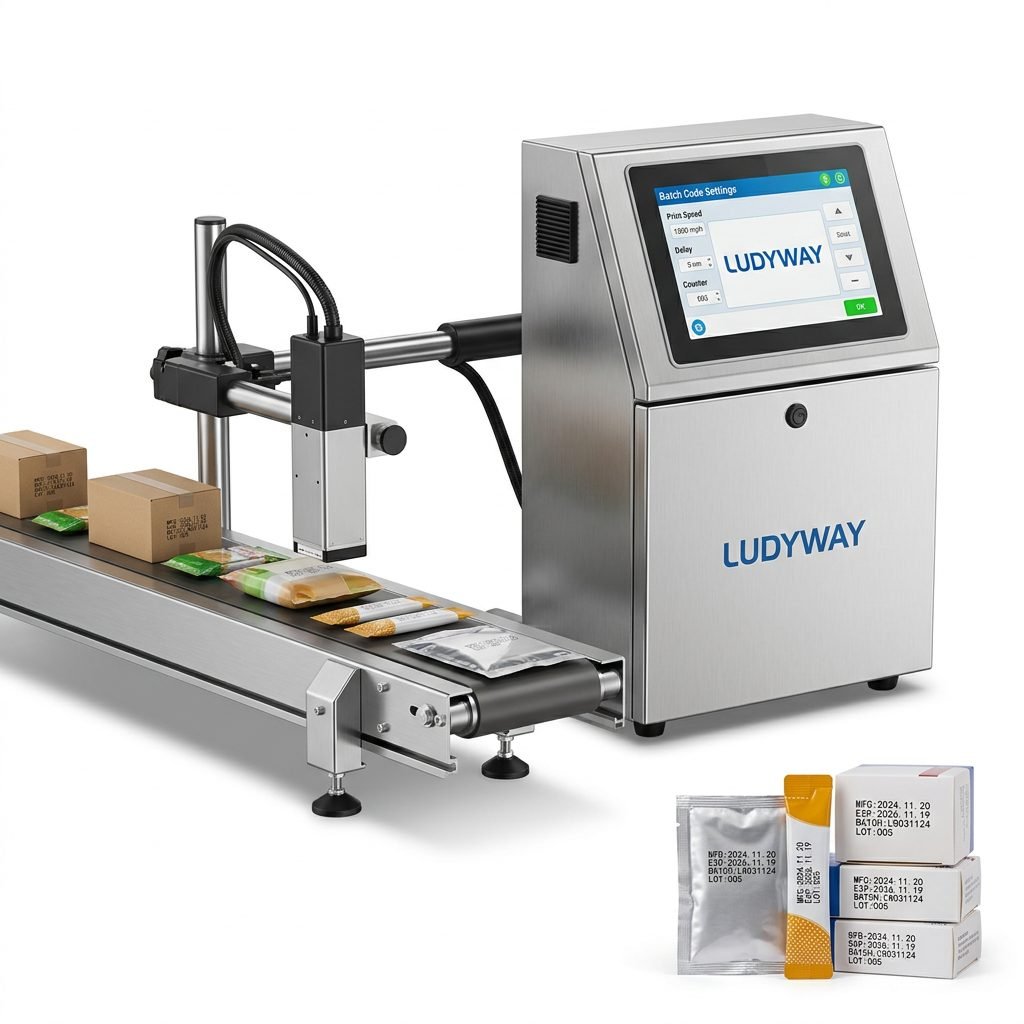
Why Packaging Line Efficiency Matters for Business Performance
Efficiency is not just an engineering metric. It affects broader business results, including:
- Cost per unit
- Labor utilization
- Material waste
- On-time delivery
- Production planning accuracy
- Return on equipment investment
For growing manufacturers, raising line efficiency by even a few percentage points can create a meaningful increase in available output without adding another full production line.
Packaging Line Efficiency vs OEE: What’s the Difference?
These two terms are closely related, but they are not always used in exactly the same way.
| Metric | Main Focus | Use Case |
|---|---|---|
| Packaging Line Efficiency | Overall production effectiveness of the packaging line | Daily operations, output comparison, line optimization |
| OEE | Availability, performance, and quality in a standardized framework | Continuous improvement, benchmarking, lean manufacturing |
If your factory already tracks OEE, you can use the same data structure to evaluate packaging line efficiency more precisely.
Best Practices for Measuring Efficiency Accurately
- Define standard machine speed clearly
- Separate planned stops from unplanned stops
- Count only good output in final efficiency calculations
- Use the same measurement period every time
- Measure at line level, not only at single-machine level
- Review trends by shift, product, and operator team
Choosing the Right Packaging Equipment for Higher Efficiency
Efficiency improvement starts long before production begins. It often depends on whether the packaging system is properly matched to the product, capacity target, and factory workflow.
When selecting equipment, pay attention to:
- Actual stable speed, not only maximum speed
- Filling accuracy
- Ease of cleaning and maintenance
- Changeover simplicity
- Compatibility with upstream and downstream equipment
- Technical support and spare parts availability
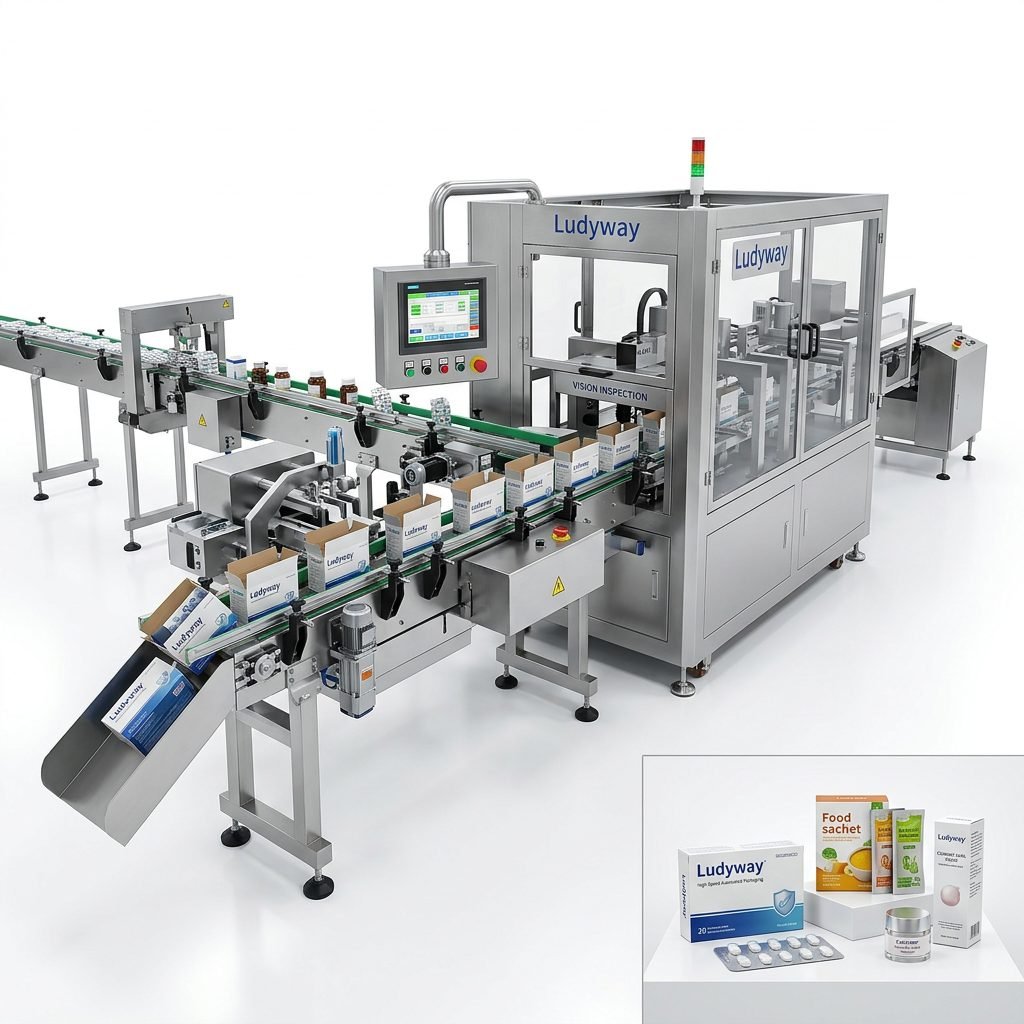
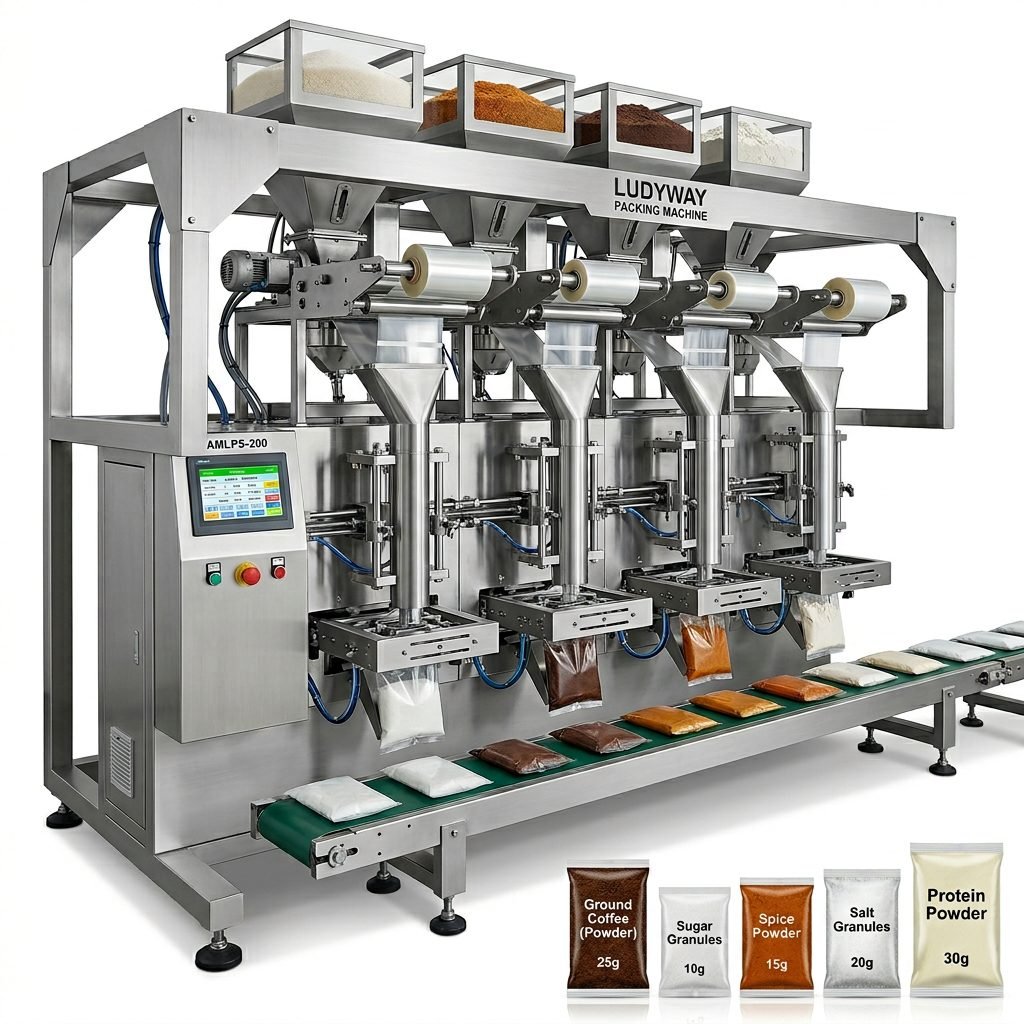
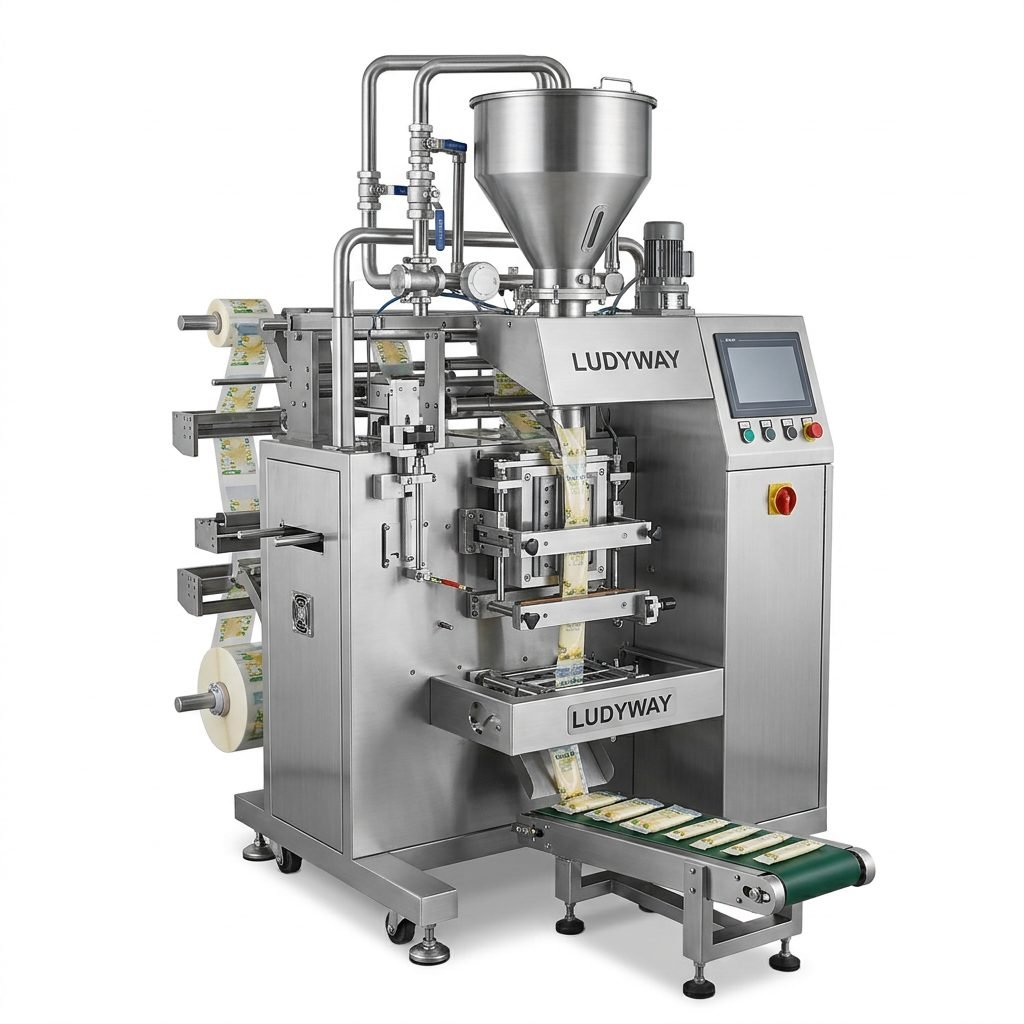
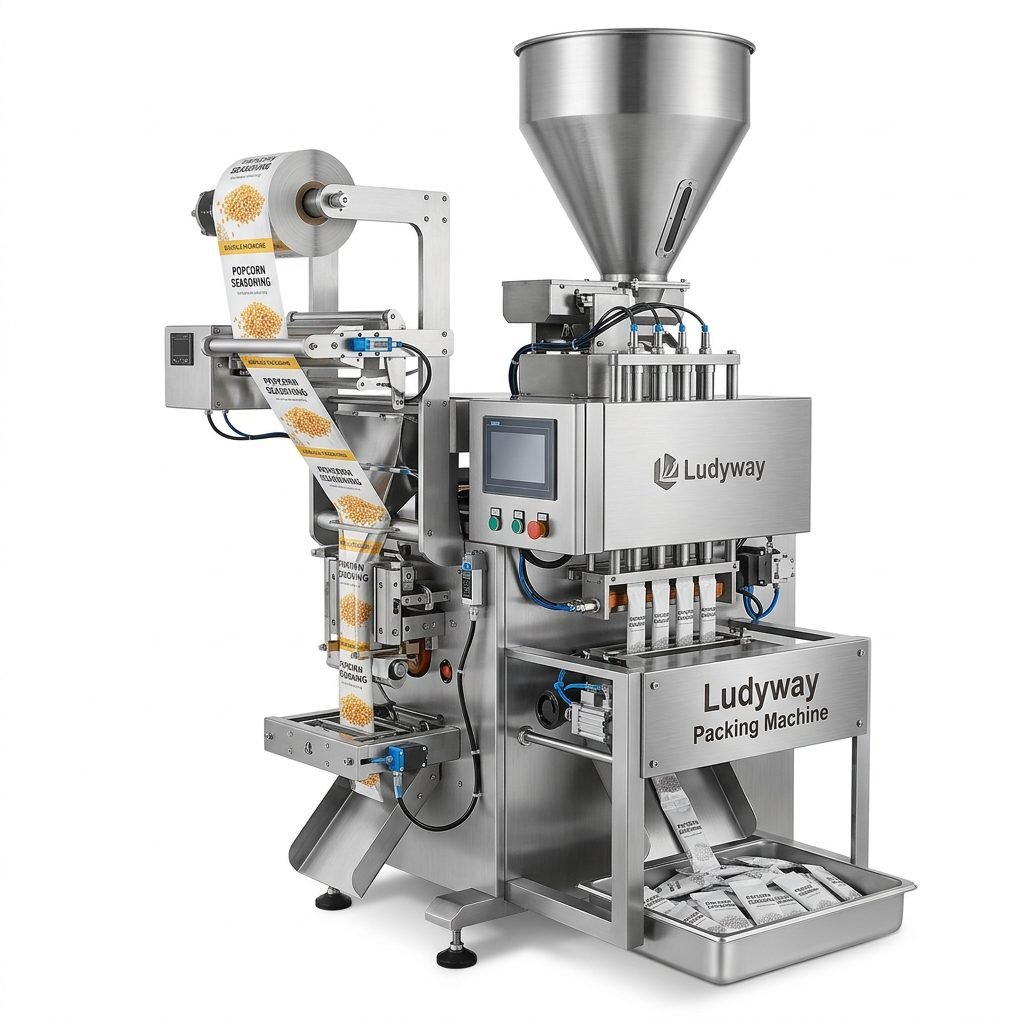
For companies planning automated or turnkey projects, working with an experienced supplier can reduce integration risk. Ludyway packaging line solutions are used across food, pharmaceutical, health supplement, cosmetic, chemical, and related industries where stable performance and scalable automation are important.
Final Calculation Checklist
Before reporting your packaging line efficiency, confirm the following:
- The production period is clearly defined
- Planned and unplanned downtime are separated
- The standard speed is realistic and documented
- Rejects are removed from good output
- The line is measured as a full system
- Results are compared over time for trend analysis
FAQ
How often should packaging line efficiency be measured?
It is best measured by shift, daily, weekly, and monthly. Shift-level data helps solve immediate issues, while monthly trends support strategic improvement.
Should changeover time be included?
Yes, if you want a realistic view of total line performance. Excluding changeovers can make efficiency look better than actual plant performance.
What is the fastest way to improve line efficiency?
In many factories, the fastest gains come from reducing unplanned downtime, improving line balancing, and lowering reject rates.
Can a fully automatic line still have low efficiency?
Yes. Automation improves potential output, but poor setup, bad maintenance, unstable materials, or weak integration can still reduce real efficiency.